On next Tuesday, June 5, from noon to almost 7 pm HST, Venus will cross the Sun for the last transit until the year 2117. It's the final time anyone alive today will have a chance to see this rare astronomical event. Bookmark this page for June 5, 2012, when we will be streaming live from the summit of Mauna Kea on the Big Island of Hawaii. Please see below the webstream window for more information about where on the Big Island to safely view the Venus Transit.
Free live streaming by Ustream
Volcano Advisories
Bookmark this page for June 5, 2012, when we will be streaming live from the summit of Mauna Kea on the Big Island of Hawaii. Please see below the webstream window for more information about where on the Big Island to safely view the Venus Transit.
Streaming by Ustream
Click here for side by side thermal and visible camera view
Click Here for Katla camera view
Recorded video of eruptions
Links
Volcano plume forecast data
Side by side view of Volcano Thermal image and visible webcams
Aircraft radar in UK airspace
Web cam views of volcano
More live webcams of Iceland Volcano
Timeline webcam images
These timeline images are added to by the webcam every few minutes.
This is due to the load on the webcam which crashed
Live EARTHQUAKE info
Volcano forum
Seismic activity charts iceland
Family & Friends photos
of volcano
Awesome photos
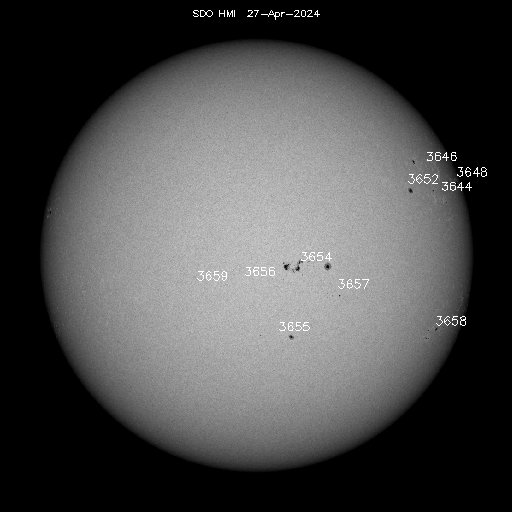
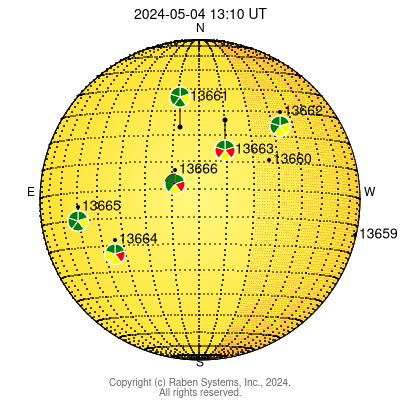
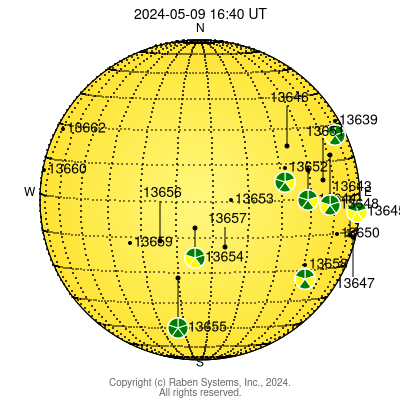
RELATED SOLAR AND EARTHQUAKE ACTIVITIES
The green curve represents the sun activity.
The red and grey columns the largest Earth- quake magnitude of that day
The numbers in the columns stand for the number of Earthquakes above 2.5 on that day


Volcanos and solar activity
Solar activity and seismic activity volcanos 2

Sun activity and earthquakes & volcanos

Sun activity and earthquakes & volcanos

Sun activity and earthquakes & volcanos

Sun activity and earthquakes & volcanos


Bolivia - South America
Is a super volcano soon to erupt?
Researchers from several universities are essentially working as geological detectives, using a suite of tools to piece together the restive peak's past in order to understand what it is doing now, and better diagnose what may lie ahead.
It's a mystery they've yet to solve.
Uturuncu is a nearly 20,000-foot-high (6,000 meters) volcano in southwest Bolivia. Scientists recently discovered the volcano is inflating with astonishing speed.
"I call this 'volcano forensics,' because we're using so many different techniques to understand this phenomenon," said Oregon State university professor Shan de Silva, a volcanologist on the research team. [See images of the inflating volcano here.]
Researchers realized about five years ago that the area below and around Uturuncu is steadily rising — blowing up like a giant balloon under a wide disc of land some 43 miles (70 kilometers) across. Satellite data revealed the region was inflating by 1 to 2 centimeters (less than an inch) per year and had been doing so for at least 20 years, when satellite observations began.
"It's one of the fastest uplifting volcanic areas on Earth," de Silva told OurAmazingPlanet."What we're trying to do is understand why there is this rapid inflation, and from there we'll try to understand what it's going to lead to."
Scientists figured out from the inflation rate that the pocket of magma beneath the volcano was growing by about 27 cubic feet (1 cubic meter) per second.
"That's about 10 times faster than the standard rate of magma chamber growth you see for large volcanic systems," Perkins told OurAmazingPlanet.
However, no need to flee just yet, the scientists said.
De Silva went on to say "It's not a volcano that we think is going to erupt at any moment, but it certainly is interesting, because the area was thought to be essentially dead".
Links
Volcano plume forecast data
Aircraft radar in UK airspace
Seismic activity charts iceland
The charts to take notice of are the "esk" for
Eyjafjallajökull
and "hvo" for katla although some seismic activity will be shown in all Live EARTHQUAKE info
The “Ring of Fire” also called the Circum-Pacific belt, is the zone of earthquakes surrounding the Pacific Ocean — about 90% of the world’s earthquakes occur there. The next most seismic region (5-6% of earthquakes) is the Alpide belt (extends from Mediterranean region, eastward through Turkey, Iran, and northern India.
The greatest mountain range is the Mid-Ocean Ridge, extending 64,374 km (40,000 mi) from the Arctic Ocean to the Atlantic Ocean, around Africa, Asia, and Australia, and under the Pacific Ocean to the west coast of North America. It has a greatest height of 4207m (13,800 ft) above the base ocean depth.
Subduction is the process of the oceanic lithosphere colliding with and descending beneath the continental lithosphere.